
This very nice lady was seeing me in spine clinic. Her spine was slowly collapsing, its low-density bone submitting to the constant pull of gravity. She didn’t need a neurosurgeon. She needed a primary care doctor to manage her osteoporosis, or low bone density.
Yet, here she was, six months after I initially saw her, without a primary care doctor.
She has insurance coverage through Medicaid, the joint state-federal program that covers the poor. Her coverage guarantees she doesn’t need to pay for medical care.
If she can get it.
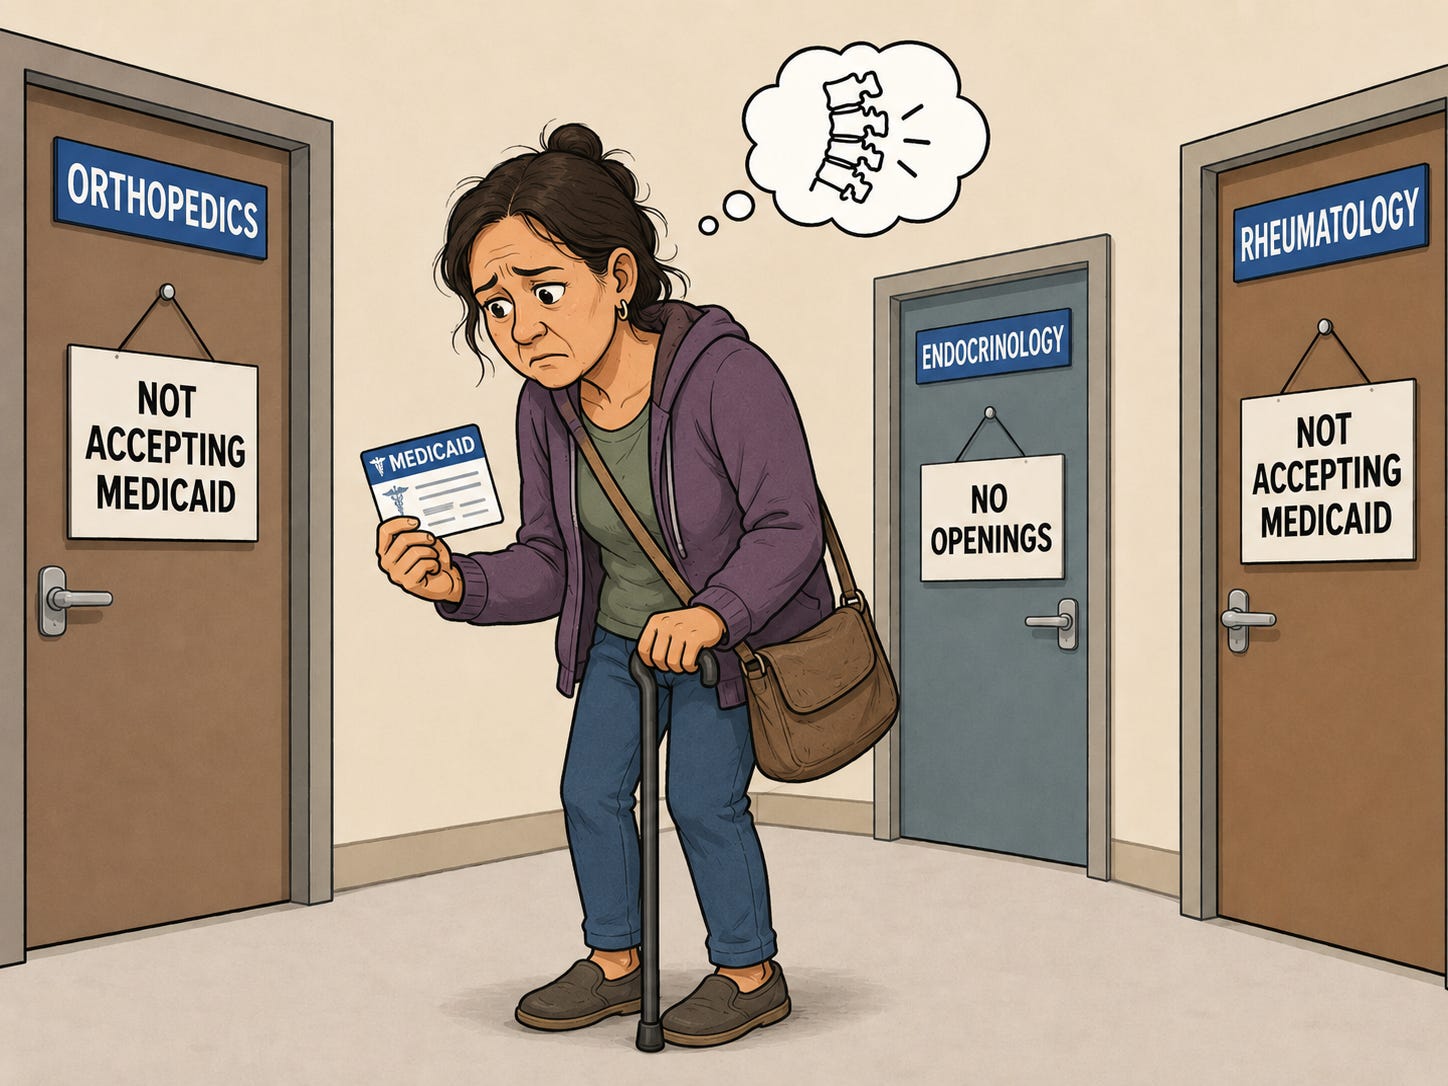
For Medicaid patients, payment is only part of the problem. Finding a physician who will give an appointment to a Medicaid patient is a larger problem. An INQUIRY meta-analysis combined 34 appointment-audit studies and found that, compared with privately insured patients, Medicaid patients had a 1.6-fold lower likelihood of successfully scheduling primary care and a 3.3-fold lower likelihood of scheduling specialty care. A New England Journal of Medicine audit of pediatric specialty clinics found that 66 percent of Medicaid–CHIP callers were denied an appointment, compared with 11 percent of privately insured callers. Even at clinics accepting both, publicly insured children waited an average of 42 days, compared with 20 days for privately insured children. Simulated-patient studies in California and Michigan have likewise found substantial primary-care barriers and longer dermatology waits for Medicaid patients, respectively.
This is not surprising. A Health Affairs analysis documents that Medicaid physician fees lag Medicare fees, and a GAO comparison likewise found lower Medicaid payments than private insurance. On top of that, Medicaid patients are often more complex and sicker at baseline, have lower levels of education requiring lengthier patient education, and are more likely to miss appointments. The doctors can’t be blamed. They are simply following incentives. If someone is paid $100 to do A and $1,000 to do B, that person will tend to do much more B than A.
When Medicaid patients can’t get care through clinic appointments, they turn to the emergency room. This, again, is well documented. A study by Decker in INQUIRY found that Medicaid fee cuts were associated not only with fewer ambulatory visits but also with a shift away from physician offices and toward hospital outpatient departments and emergency departments.
Unsurprisingly, increasing the rate paid to doctors increases access for those patients. In 2013 and 2014, the federal government temporarily raised selected Medicaid primary-care payments to Medicare levels. In a New England Journal of Medicine study, Polsky and colleagues used researchers posing as patients to call practices in ten states before and after the increase. Appointment availability for Medicaid patients rose from 58.7 percent to 66.4 percent. Across states, each 10 percent increase in reimbursement was associated with a 1.25-percentage-point increase in appointment availability.
There is no ground truth about what the correct payment rate is. Rates are determined by markets, reflecting both supply and demand. This applies to clinic appointments just as it does to any other good or service. If Medicaid is going to set rates outside of the market, adequacy should be measured by whether patients can actually obtain care.
According to CMS, there is no single federal Medicaid fee schedule. States establish fee-for-service rates and design their managed-care payment systems, while managed-care plans negotiate many of their base provider rates. Federal law imposes requirements, and CMS approves state plans, contracts, and certain state-directed payments, but states make most of the consequential payment choices.
Medicaid payment is complex. It is shared between the state and the federal government, and that ratio changes based on the beneficiary. If a state wants to pay doctors more to see patients, it can do so, but it bears some of the cost. The federal government then provides an open-ended match at the state’s applicable federal medical assistance percentage, or FMAP.
The Congressional Research Service notes that general-fund appropriations are only one possible source of that nonfederal share. States also use local-government transfers, certified public expenditures, and health-care provider taxes. In state fiscal year 2024, general funds supplied about 68 percent of states’ share of Medicaid costs; other state and local sources supplied the remainder. By fiscal year 2025, every state except Alaska (which has all that sweet oil revenue) used at least one provider tax, which is one mechanism to gain more federal funding than would otherwise be available under traditional federal matching.
Under 42 C.F.R. § 433.68’s indirect-guarantee test, taxes producing no more than 6 percent of the class’s net patient revenue pass the first prong; taxes above that level face the “75/75” test: CMS treats the arrangement as an impermissible indirect guarantee if at least 75 percent of the taxpayers in the class receive at least 75 percent of their total tax costs back through enhanced Medicaid or other state payments. If the 75/75 threshold is crossed, the entire amount of tax revenue is offset against the state’s Medicaid expenditures when federal matching funds are calculated. A Congressional Research Service summary of P.L. 119-21 explains that Congress has now frozen or constrained many taxes and will phase the threshold for most provider classes in Medicaid-expansion states down to 3.5 percent by fiscal year 2032.
From the state’s perspective, the logic is compelling. Provider taxes can preserve benefits or raise rates without competing for as many unrestricted dollars from schools, roads, or other state priorities.
The federal taxpayer’s objection is equally compelling. A 60 percent matching rate ordinarily requires the state to decide that a dollar of Medicaid spending is worth 40 cents of its own fiscal resources. If the 40 cents instead comes from providers who expect to share in a much larger payment, the state may have little unrestricted money at risk. Its incentive to act as a prudent purchaser weakens while federal taxpayers still supply 60 cents on the dollar.
Regardless of the mechanism, more Medicaid funding potentially means more payments for doctors so that patients can find clinicians.
Florida’s academic-medical-center physician program illustrates the attraction. An earlier approval package calculated increases intended to bring participating faculty practices to the average commercial rate, then estimated at 194.5 percent of Medicare. In the February–September 2025 amendment, base payment levels for participating academic practices ranged from 16 to 75 percent of the program’s benchmark; the directed payments brought each to 100 percent. CMS approved as much as $260.9 million for that partial-year amendment.
But Florida also demonstrates why terminology matters. A state-directed payment is the way money is paid through managed care; it is not itself the financing source. Florida’s current filing identifies intergovernmental transfers—not a provider tax—as the nonfederal financing mechanism. The recipients are academic faculty practice plans and affiliated groups, not necessarily independent doctors.
Texas’s Incentive for Physicians and Professional Services program, or TIPPS, is a closer provider-tax comparison. CMS approved up to $645.4 million for September 2025 through August 2026. Depending on the Medicaid managed-care program, the directed payments raise reported total payment for academic physician groups from base levels of roughly 24–37 percent to approximately 55–85 percent of the commercial benchmark. “Other” physician groups remain lower, at roughly 37–52 percent.
That may be an intelligent redistribution from hospitals toward physician access. But it raises questions the approval package does not fully answer. How much remains with large academic groups? How much becomes physician compensation or additional clinic capacity? Are independent practices disadvantaged? Do patients obtain appointments sooner? Texas ties part of the program to quality measures and identifies increased primary and preventive care as a goal.
States do not always use the fiscal room created by provider taxes to raise ordinary clinic payments. Money is fungible, and, put in the hands of politicians, it can fund numerous pet projects.
As a CMS State Medicaid Director letter explains, some states use state-only dollars to fund full-scope coverage for individuals otherwise ineligible because of undocumented immigration status. Likewise, CMS has approved Medicaid coverage of “traditional healthcare practices” such as ritual dancing or drumming. CMS guidance also describes Medicaid coverage of nonemergency transportation to medical care, while separate CMS guidance discusses housing-related assistance and nutrition. It’s not unreasonable to think that some of these funds are distributed to politically connected NGOs.
Yet, despite these abuses, some states undeniably improve access for Medicaid patients with these funds.
That is why an August 2026 ASPE report is so important. It gives an economic argument to limit these directed payments. Its model predicts that the limits will reduce non-Medicaid prices by as much as 3.5 percent in markets with provider taxes and produce $502 billion to $875 billion in benefits for non-Medicaid consumers from 2025 through 2034.
First, a provider tax raises a provider’s marginal cost and may be passed through into commercial prices. Second, large supplemental Medicaid payments can make Medicaid business more attractive. When provider capacity cannot expand quickly, clinicians and facilities may shift capacity from commercially insured patients toward Medicaid patients, increasing non-Medicaid prices. Linking Medicaid payment to the average commercial rate can amplify the feedback: higher commercial prices permit higher Medicaid payments, which then support more federal matching funds.
This model has a normative implication that should be stated plainly. The capacity-crowding mechanism is not unique to provider taxes or state-directed payments. If a state used ordinary tax revenue to increase Medicaid payment, the higher Medicaid price could still attract finite provider capacity away from non-Medicaid patients. Taken to its logical conclusion, this becomes an argument against paying Medicaid providers more regardless of the financing mechanism.
The ASPE report counts lower non-Medicaid prices as a benefit. Yet, if Medicaid patients can’t find appointments and end up crowding ERs, nobody wins.
The federal government should reward arrangements that demonstrably improve access.
There is no perfect answer. Provider-tax restrictions can reduce federal arbitrage but also cause states to cut already inadequate payments. Average-commercial-rate benchmarks can improve access but can also import commercial market power into Medicaid. Medicare benchmarks are more transparent but may be inadequate in some markets. Access measures can themselves be gamed.
As Thomas Sowell wrote in “Housing Hurdles,” “There are no solutions. There are only trade-offs.”
My patient does not care whether her eventual primary-care appointment is financed by general revenue, an intergovernmental transfer, or a lawful provider tax. She cares whether an actual clinic will see her before another fracture occurs.
That’s all that matters in the end.